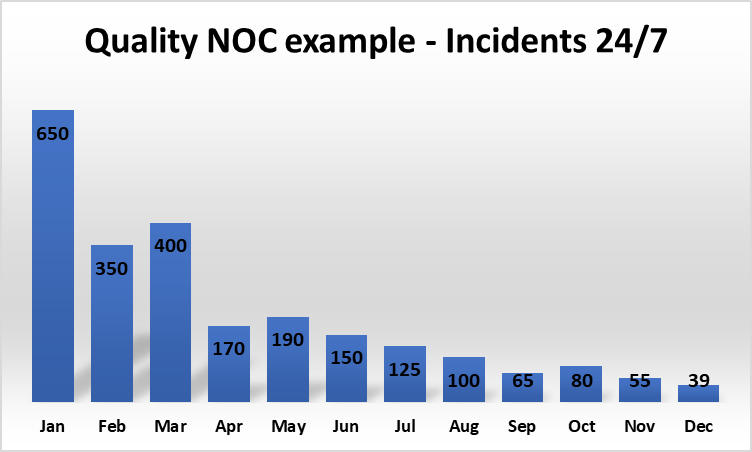
Quality NOC has an expert Operations and Monitoring Team for your organization. We team up and work together with your developers, DevOps teams or we can work stand alone.
We have Knowledge and Experience in:
Windows and Linux Operating Systems.
Infrastructure services.
Network operation.
Scripting (PowerShell, Shell and Python).
Backup SW: Veeam, commvault, veritas, barracuda…
Operation of SAN/NAS storage systems.
Execution of backup strategies.
Features:
Resolution of incidents and requests
Backup supervision.
Execution/Optimization of backup plans.
HA/Failover/Replication strategies.
Storage infrastructure management.
Support by chat, telephone or other means of communication.
Verify, according to the protocol designed by the client, backups and replications.
Escalate and coordinate with the rest of the client’s areas the incidents that may arise from each configuration until they are resolved.
Use of the client’s internal systems for incident management and resolution.
We have the solution, 5 years working together with European Telecom Operations teams, different telecoms, data centres and hosting platforms Trust us.
Your company will benefit from our know-how, experience and proactive work.
You will experience a big reduction of incidents with your company/business.
Outsourced NOC services working together with your IT team.
To read more click here.
Contact us we are open to hear about your needs and prepare a free quotation.
How tools and practices used for monitoring cloud-native services apply to solutions that use IoT devices. Add operations visibility to remote locations.
Introduction
IoT devices produce many types of information, including telemetry, metadata, state, and commands and responses
Telemetry data from devices can be used in short operational timeframes or for longer-term analytics and model building.
Many devices support local monitoring in the form of a buzzer or an alarm panel on-premises. This type of monitoring is valuable, but has limited scope for in-depth or long-term analysis. This article instead discusses remote monitoring, which involves gathering and analyzing monitoring information from a remote location using cloud resources.
Operational and device performance data is often in the form of a time series, where each piece of information includes a time stamp. This data can be further enriched with dimensional labels (sometimes referred to as tags), such as labels that identify hardware revision, operating timezone, installation location, firmware version, and so on.
Time-series telemetry can be collected and used for monitoring. Monitoring in this context refers to using a suite of tools and processes that help detect, debug, and resolve problems that occur in systems while those systems are operating. Monitoring can also give you insight into the systems and help improve them.
The state of monitoring IT systems, including servers and services, has continuously improved. Monitoring tools and practices in the cloud-native world of microservices and Kubernetes are excellent at monitoring based on time-series metric data. These tools aren’t designed specifically for monitoring IoT devices or physical processes, but the constituent parts—labeled series of metrics, visualization, and alerts—all can apply to IoT monitoring.
What are you monitoring?
Monitoring begins with collecting data by instrumenting the system you’re working with. For some IoT scenarios, the system you’re monitoring might not be the devices themselves, but the environment and the process external to the device. In other scenarios, you might be interested in monitoring the performance health of the devices themselves, both individually and at the fleet level.
Consider the task of monitoring a human cyclist riding on a road. There are many different parts of the overall system you can monitor. Some might be internal to the system, such as the cyclist’s heart rate or sweating rate. Others might be external to the cyclist, such as a slope of the road, or external temperature and humidity. These internal and external monitoring goals can coexist. The methodologies and tools might overlap, but you can recognize these different domains—a physician might care about different measurements than the bike mechanic. Monitoring tools can be used to create custom monitoring views.
For example, you might organize your metrics into the categories that are discussed in this section. The specifics of how these are structured or combined will depend on the particular domain and applications.
Device hardware metrics
Device hardware metrics are measurements of the hardware or physical device itself, usually with some sort of built-in sensor.
Firmware
Software running on the devices includes application software as well as the system software itself, which might be the operating system, or layers of a networking stack or device drivers.
Application code
Application code on the device is specific to the role that device is performing in the system.
External environment
Measuring the environment with sensors is often what people think about with regard to IoT devices.
Cloud device interactions
An IoT solution is a complex system that includes software components that run both on the device and in the cloud. Understanding how these two systems interact requires you to understand what information each side has access to and how to bridge the two software runtime environments.
Supporting systems
A complete monitoring solution requires monitoring both core and supporting components. Monitoring the application code on the device is an example of whitebox monitoring, where you’re interested in how the application is functioning. You probably also want to include some blackbox monitoring. For example, your monitoring software can probe APIs and other cloud services that your solution depends on. When you’re trying to respond to a problem, having these blackbox probes in place can lead to much faster resolution.
Alerting
Alerting is about getting warnings or notifications, and helps draw your attention to important conditions. These in turn often lead you to check visualisations and often the associated log information.
A problem with alerting is that humans are good at learning to ignore annoying “noise” (think of traffic noise, repetitive emails, and so on). Alerts are only valuable if they can be responded to and then appropriately dismissed. If an alert reports an issue that can’t be addressed, the information in the alert should instead be another metric or visualisation.
Open-source choices are good and can even match commercial tools, but you should know that using open-source monitoring requires a high level of involvement with the tool, which may not suit your needs. Open source requires a significant investment in time and resources to learn, install, configure, and use. Features may have to be built with the help of community support or an in-house IT team. The second consideration is security, which becomes an issue if your enterprise has strict security guidelines. Immediate custom fixes may not be available unless you spend time developing them. Or there could be instances when major security flaws aren’t discovered in the auditing process.
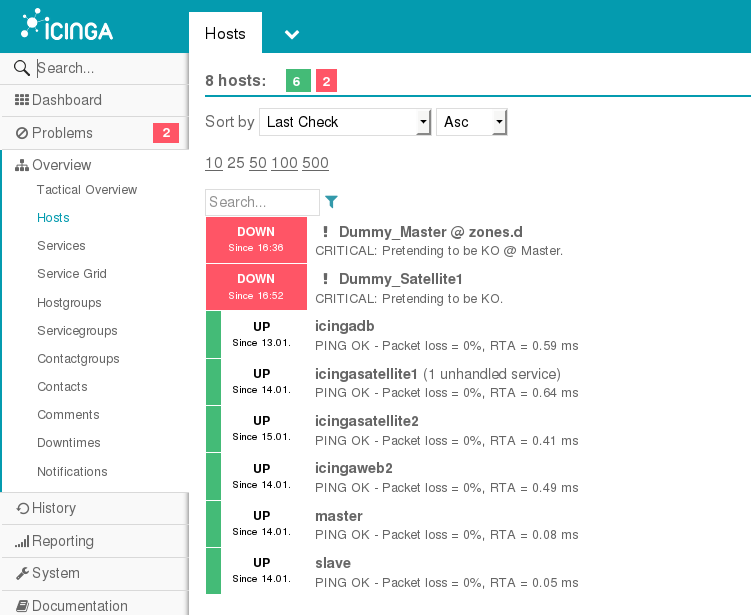
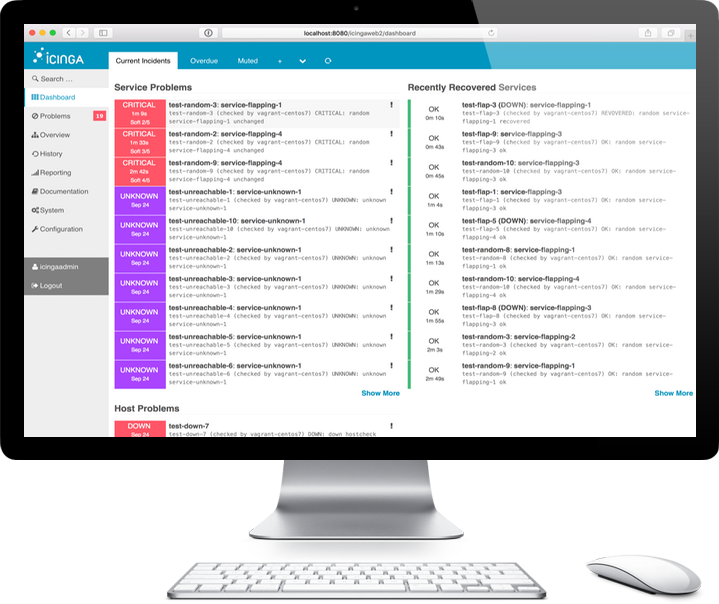
Icinga 2 is an open source monitoring system which checks the availability of your network resources, notifies users of outages, and generates performance data for reporting.
Scalable and extensible, Icinga 2 can monitor large, complex environments across multiple locations.
If you have NAGIOS clients already in your systems, the migration is very easy you can continue using same NAGIOS clients as they are like Nagios NRPE, NSClient, etc.
Many companies used NAGIOS for years and now have migrated to Icinga2.
Nagios® is one of the most popular and widely used free network monitoring tools. Network admins like Nagios because it does everything. Whatever it doesn’t have can be built, or has been built by the Nagios community.
There are two versions of Nagios. Nagios Core is open source and free, and Nagios XI is a commercial tool based on the Nagios Core but with added features. Nagios is popular due to its active development community and external plug-in support. You can create and use external plugins in the form of executable files or Perl® and shell scripts to monitor and collect metrics from every hardware and software used in a network. There are plugins that provide an easier and better GUI, address many limitations in the Core®, and support features, such as auto discovery, extended graphing, notification escalation, and more. Nagios can be overwhelming for beginners and enterprises that do not have enough IT support staff, but it provides good monitoring powers. For support, users can always get help from the Nagios community, or opt for a commercial support package from Nagios Enterprise. Quality NOC can provide support for installation, configuration and development of new features to check software and hardware.
If you have the time to invest in learning and mastering this tool, Nagios Core offers good network monitoring capabilities.
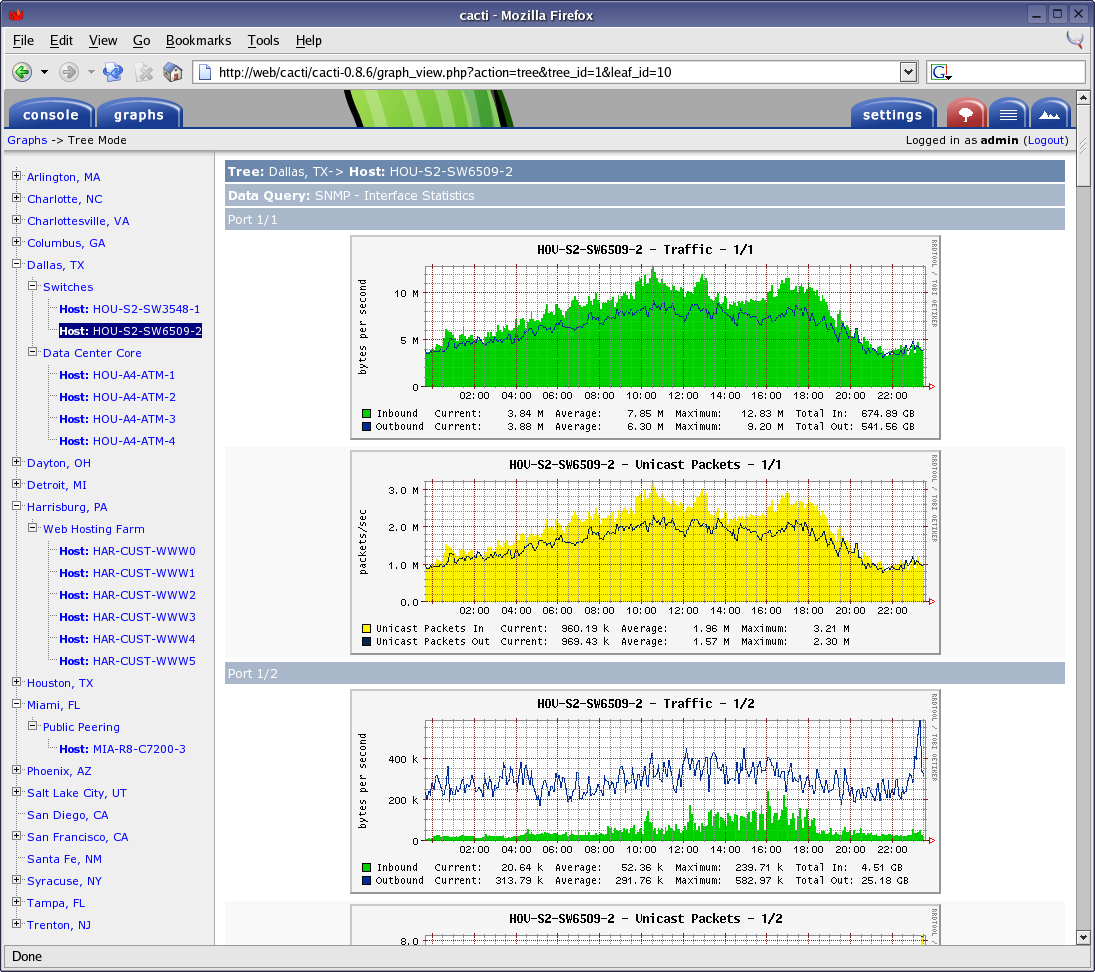
Cacti® is a network monitoring tool that allows you to collect data from almost any network element, including routing and switching systems, firewalls, load balancers, and servers, and put that data into robust graphs. If you have a device, it’s possible that Cacti’s active community of developers has created a monitoring template for it.
Cacti supports SNMP polling, which itself covers a wide range of network devices. You can also extend Cacti’s capabilities to use scripts, queries, or commands for data collection, and save it as a template to use for polling other devices for similar data sets. Cacti leverages the power of RRDTool, which is an open-source data logging and graphing system for storing polled data in the database, and creating graphs from the stored data sets. RRDTool’s data consolidation lets you store collected data forever, and is limited only by the size your storage. Cacti leveraging on RRDTool has the ability to generate any type of graph for any data set, and the graphing used in Cacti is the standard used by many open-source and commercial tools. Cacti also allows you to add multiple users and give them access with or without edit permissions, which is perfect for service providers and enterprises with a large NOC team.
Cacti’s strength lies in its community of developers who have contributed many plug-ins, scripts, and templates that can be used to monitor almost every type of device. We especially like its device support and graphing capabilities.
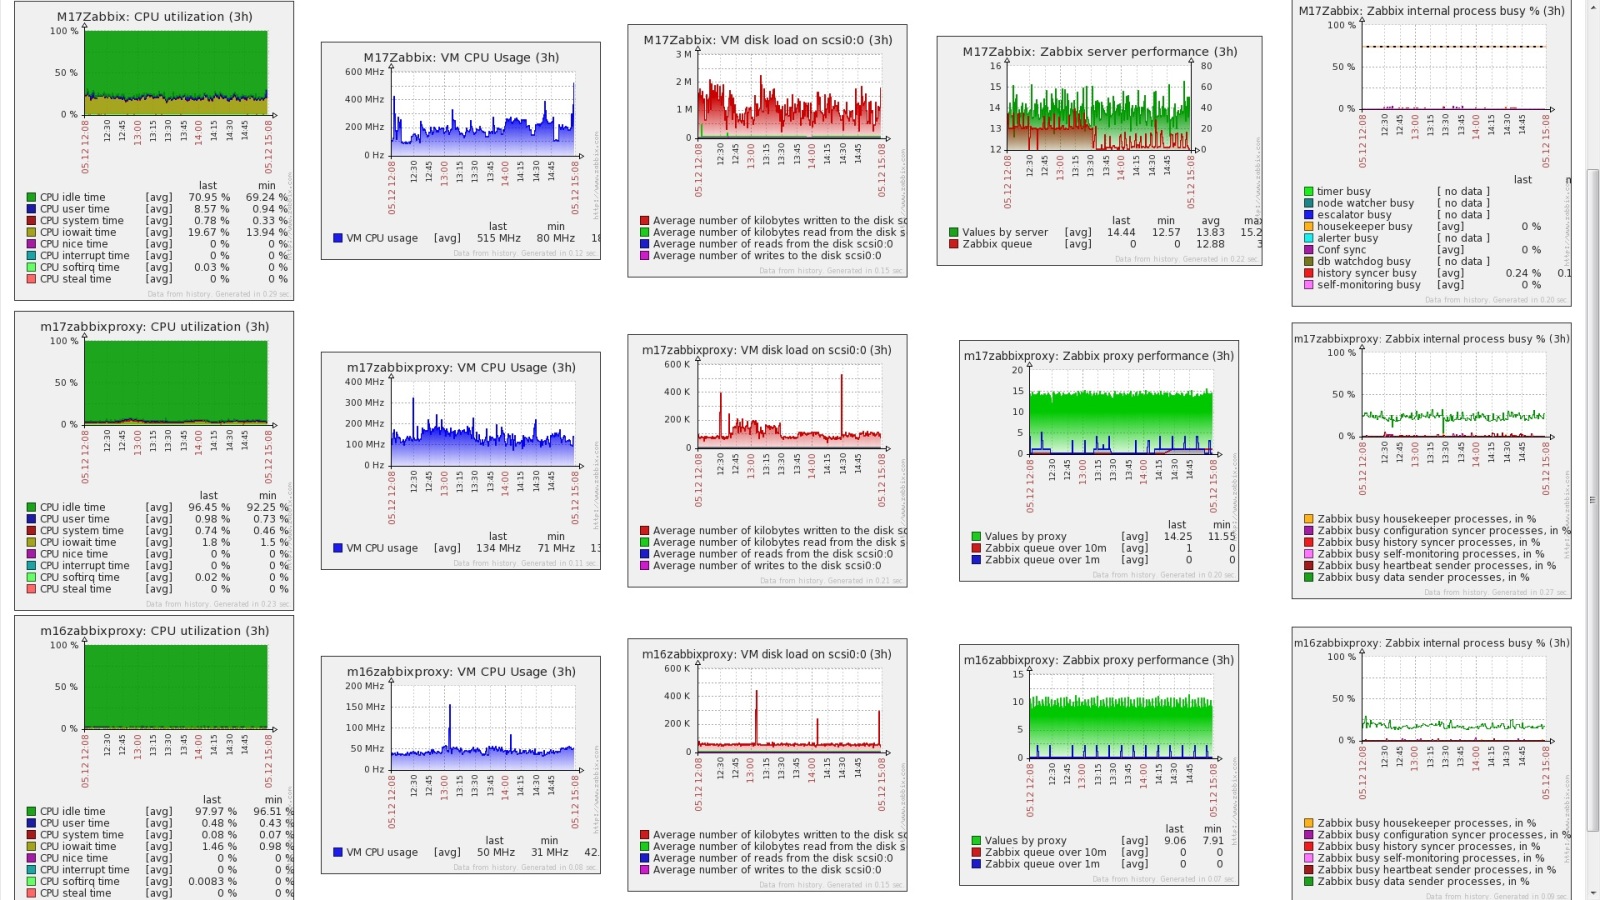
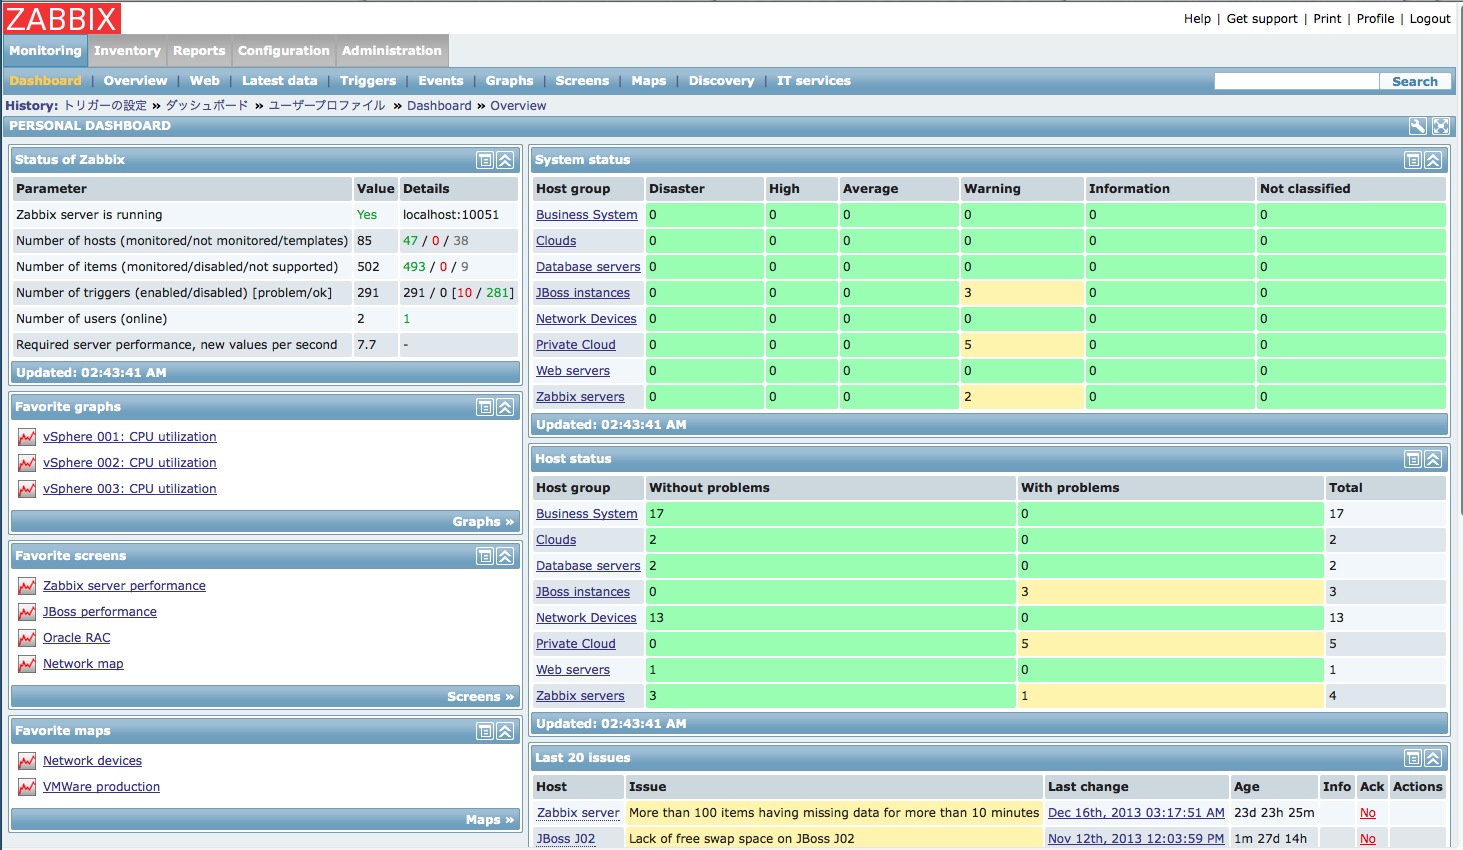
Zabbix is probably the most widely used open-source network monitoring tool after Nagios
Complex to set up, Zabbix® comes with a simple and clean GUI that makes it easy to manage, once you get the hang of it.
Zabbix supports agent-less monitoring using technologies such as SNMP, ICMP, Telnet, SSH, etc., and agent-based monitoring for all Linux® distros, Windows® OS, and Solaris®. It supports a number of databases, including MySQL®, PostgreSQL™, SQLite, Oracle®, and IBM® DB2®. Zabbix’s VMware® monitoring capabilities allow you to customize using any scripting or programming language, which is widely regarded as its best feature.
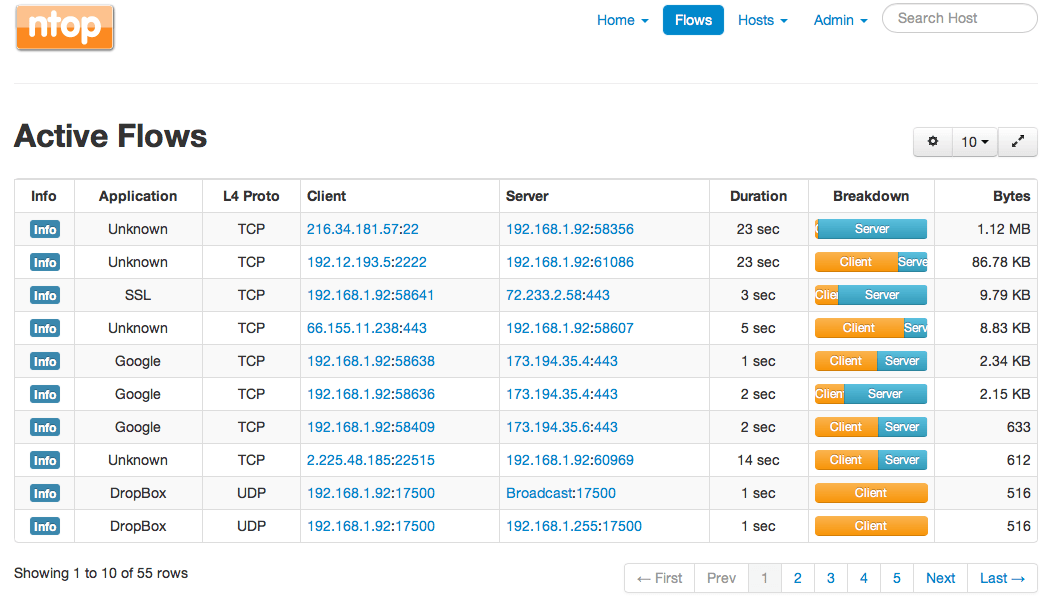
ntop, which is now ntopng (ng for next generation), is a traffic probe that uses libpcap (for packet capture) to report on network traffic.
You can install ntopng on a server with multiple interfaces, and use port mirroring or a network tap to feed ntopng with the data packets from the network for analysis. ntopng can analyze traffic even at 10G speeds; report on IP addresses, volume, and bytes for each transaction; sort traffic based on IP, port, and protocol; generate reports for usage; view top talkers; and even report on AS information. This level of traffic analysis helps you make informed decisions about capacity planning and QoS design, and also helps you find bandwidth-hogging users and applications in the network. ntopng has a commercial version called ntopng pro that comes with some additional features, but the open-source version is good enough to quickly gain insight into traffic behavior. ntop can also integrate with external monitoring applications such as Nagios for alerting, and provide data for monitoring.
Ntopng has some limitations, but the level of network traffic visibility it provides makes it well worth the effort.
NOC services involve the continuous monitoring and management of an organisation’s IT infrastructure to keep it running smoothly and efficiently, 24/7. The NOC provides round-the-clock proactive monitoring and management to enable issues to be caught and resolved before they become potential show-stoppers. The effective NOC relies heavily on automation; in particular, the use of sophisticated remote monitoring and management (RMM) tools.
The NOC’s main purpose is to maximise uptime; to ensure IT runs optimally without any negative impact on productivity; and to proactively address any potential emergencies.
Manage Cookie Consent
We use cookies to optimize our website and our service.
Functional
Always active
The technical storage or access is strictly necessary for the legitimate purpose of enabling the use of a specific service explicitly requested by the subscriber or user, or for the sole purpose of carrying out the transmission of a communication over an electronic communications network.
Preferences
The technical storage or access is necessary for the legitimate purpose of storing preferences that are not requested by the subscriber or user.
Statistics
The technical storage or access that is used exclusively for statistical purposes.The technical storage or access that is used exclusively for anonymous statistical purposes. Without a subpoena, voluntary compliance on the part of your Internet Service Provider, or additional records from a third party, information stored or retrieved for this purpose alone cannot usually be used to identify you.
Marketing
The technical storage or access is required to create user profiles to send advertising, or to track the user on a website or across several websites for similar marketing purposes.