How tools and practices used for monitoring cloud-native services apply to solutions that use IoT devices. Add operations visibility to remote locations.
Introduction
IoT devices produce many types of information, including telemetry, metadata, state, and commands and responses
Telemetry data from devices can be used in short operational timeframes or for longer-term analytics and model building.
Many devices support local monitoring in the form of a buzzer or an alarm panel on-premises. This type of monitoring is valuable, but has limited scope for in-depth or long-term analysis. This article instead discusses remote monitoring, which involves gathering and analyzing monitoring information from a remote location using cloud resources.
Operational and device performance data is often in the form of a time series, where each piece of information includes a time stamp. This data can be further enriched with dimensional labels (sometimes referred to as tags), such as labels that identify hardware revision, operating timezone, installation location, firmware version, and so on.
Time-series telemetry can be collected and used for monitoring. Monitoring in this context refers to using a suite of tools and processes that help detect, debug, and resolve problems that occur in systems while those systems are operating. Monitoring can also give you insight into the systems and help improve them.
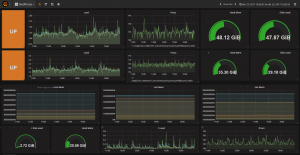
The state of monitoring IT systems, including servers and services, has continuously improved. Monitoring tools and practices in the cloud-native world of microservices and Kubernetes are excellent at monitoring based on time-series metric data. These tools aren’t designed specifically for monitoring IoT devices or physical processes, but the constituent parts—labeled series of metrics, visualization, and alerts—all can apply to IoT monitoring.
What are you monitoring?
Monitoring begins with collecting data by instrumenting the system you’re working with. For some IoT scenarios, the system you’re monitoring might not be the devices themselves, but the environment and the process external to the device. In other scenarios, you might be interested in monitoring the performance health of the devices themselves, both individually and at the fleet level.
Consider the task of monitoring a human cyclist riding on a road. There are many different parts of the overall system you can monitor. Some might be internal to the system, such as the cyclist’s heart rate or sweating rate. Others might be external to the cyclist, such as a slope of the road, or external temperature and humidity. These internal and external monitoring goals can coexist. The methodologies and tools might overlap, but you can recognize these different domains—a physician might care about different measurements than the bike mechanic. Monitoring tools can be used to create custom monitoring views.
For example, you might organize your metrics into the categories that are discussed in this section. The specifics of how these are structured or combined will depend on the particular domain and applications.
Device hardware metrics
Device hardware metrics are measurements of the hardware or physical device itself, usually with some sort of built-in sensor.
Firmware
Software running on the devices includes application software as well as the system software itself, which might be the operating system, or layers of a networking stack or device drivers.
Application code
Application code on the device is specific to the role that device is performing in the system.
External environment
Measuring the environment with sensors is often what people think about with regard to IoT devices.
Cloud device interactions
An IoT solution is a complex system that includes software components that run both on the device and in the cloud. Understanding how these two systems interact requires you to understand what information each side has access to and how to bridge the two software runtime environments.
Supporting systems
A complete monitoring solution requires monitoring both core and supporting components. Monitoring the application code on the device is an example of whitebox monitoring, where you’re interested in how the application is functioning. You probably also want to include some blackbox monitoring. For example, your monitoring software can probe APIs and other cloud services that your solution depends on. When you’re trying to respond to a problem, having these blackbox probes in place can lead to much faster resolution.
Alerting
Alerting is about getting warnings or notifications, and helps draw your attention to important conditions. These in turn often lead you to check visualisations and often the associated log information.
A problem with alerting is that humans are good at learning to ignore annoying “noise” (think of traffic noise, repetitive emails, and so on). Alerts are only valuable if they can be responded to and then appropriately dismissed. If an alert reports an issue that can’t be addressed, the information in the alert should instead be another metric or visualisation.
Source:
https://cloud.google.com/solutions/remote-monitoring-and-alerting-for-iot
https://cloud.google.com/solutions/iot-overview#operational_information
https://prometheus.io/docs/visualization/grafana/


