Partnering for NOC is an attractive alternative to MSPs who are serious about scaling up.
Network Operations Centre (NOC) is important to scale up your business, and coordinate your entire managed services operation.
The key is monitoring and managing your clients’ IT infrastructures to keep them running smoothly and efficiently, detect and resolved issues before they impact client business operations.
An effective NOC, supported by state-of-the-art remote monitoring tools, is an essential component of growth. The investment required to set up, staff and run a NOC in-house can be financially out of reach for many MSPs.
Are you able to offer a true 24/7 NOC service with ‘always on’ monitoring, remediation, maintenance and support? Can you prevent engineer overload when you add more working hours and intermittent sleep?
Partner for NOC
Here are some of those benefits:
Your team will be increased and complemented with our system administrator team, monitoring 24/7/365, who will also be available to cover holidays, sick leave and ‘double up’ during busy periods.
Our team is highly experienced people with up-to-date training in the latest, in-demand technologies and tools.
Partnering offers a cost-effective way of acquiring the skills and support you need to deliver high-quality service to your customers – Avoid higher costs and headaches when recruiting, training, managing and replacing staff.
Working together with our technicians you are more likely to meet and exceed customer expectations, doing more business with you.
Reasons to partner for NOC
Out-of-Business-hours, only working ours and 24/7 support, 365 days a year
Access to an expert team to run the NOC and work proactively.
Ability to focus on new projects rather than being distracted by day-to-day ‘noise’
Our solutions are scalable offering resources on-demand
Benefit with our pay-as-you-grow approach for a cost-effective business model
Who is monitoring 24/7 when people is on vacations?
We have a complete team of system administrators working 24/7 monitoring networks, systems, servers, applications and services.
We follow written procedures and we call your engineer following your instructions, acting immediately in case of incident. We follow up until is solved.
We have signed NDA and SLA with all our customers.
We have the solution, 5 years working together with European Telecom Operations teams, different telecoms, data centres and hosting platforms Trust us.
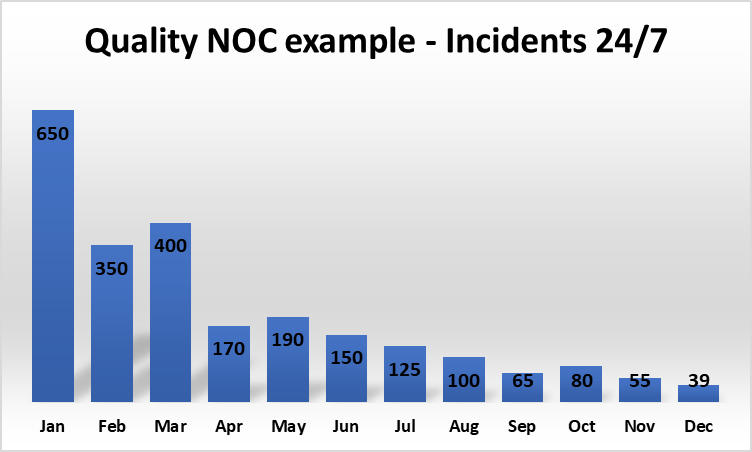
Your company will benefit from our know-how, experience and proactive work.
You will experience a big reduction of incidents with your company/business.
Outsourced NOC services working together with your IT team.
To read more click here.
Contact us we are open to hear about your needs and prepare a free quotation.
We can use your own monitoring systems, we can install a new system for you and migrate the hosts or if you have a small operation you can use our own monitoring system.
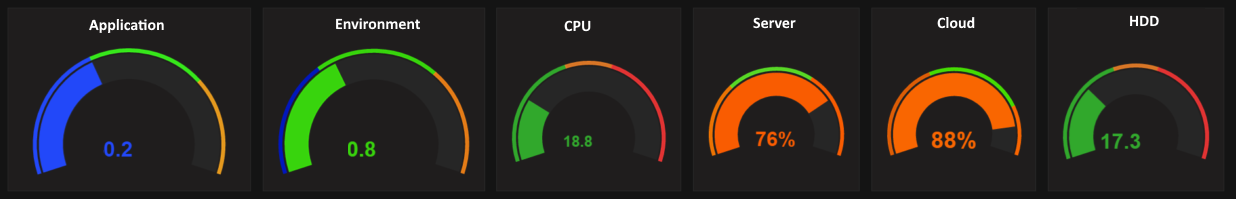
Our NOC team help our customers with:
Website Monitoring
Application Performance Monitoring
Server Monitoring
Network Monitoring
Cloud Monitoring, Private and Public
We have customers of all sizes, from a large Telecom with more than 500 hosts, mid size and small companies with only 2 hosts
Our NOC team works around the clock 24x7x365
Our customers save resources, their engineers have more time for important projects, we improve the operations and reduce downtime
Open-source choices are good and can even match commercial tools, but you should know that using open-source monitoring requires a high level of involvement with the tool, which may not suit your needs. Open source requires a significant investment in time and resources to learn, install, configure, and use. Features may have to be built with the help of community support or an in-house IT team. The second consideration is security, which becomes an issue if your enterprise has strict security guidelines. Immediate custom fixes may not be available unless you spend time developing them. Or there could be instances when major security flaws aren’t discovered in the auditing process.
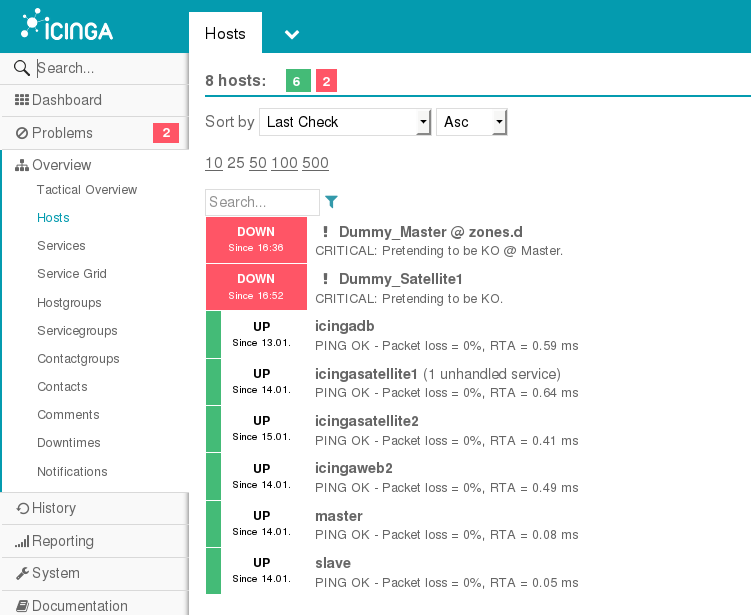
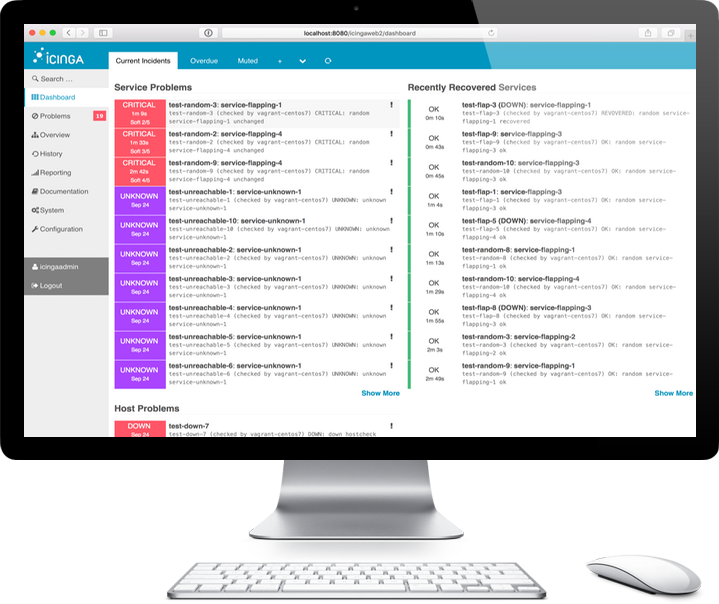
Icinga 2 is an open source monitoring system which checks the availability of your network resources, notifies users of outages, and generates performance data for reporting.
Scalable and extensible, Icinga 2 can monitor large, complex environments across multiple locations.
If you have NAGIOS clients already in your systems, the migration is very easy you can continue using same NAGIOS clients as they are like Nagios NRPE, NSClient, etc.
Many companies used NAGIOS for years and now have migrated to Icinga2.
Nagios® is one of the most popular and widely used free network monitoring tools. Network admins like Nagios because it does everything. Whatever it doesn’t have can be built, or has been built by the Nagios community.
There are two versions of Nagios. Nagios Core is open source and free, and Nagios XI is a commercial tool based on the Nagios Core but with added features. Nagios is popular due to its active development community and external plug-in support. You can create and use external plugins in the form of executable files or Perl® and shell scripts to monitor and collect metrics from every hardware and software used in a network. There are plugins that provide an easier and better GUI, address many limitations in the Core®, and support features, such as auto discovery, extended graphing, notification escalation, and more. Nagios can be overwhelming for beginners and enterprises that do not have enough IT support staff, but it provides good monitoring powers. For support, users can always get help from the Nagios community, or opt for a commercial support package from Nagios Enterprise. Quality NOC can provide support for installation, configuration and development of new features to check software and hardware.
If you have the time to invest in learning and mastering this tool, Nagios Core offers good network monitoring capabilities.
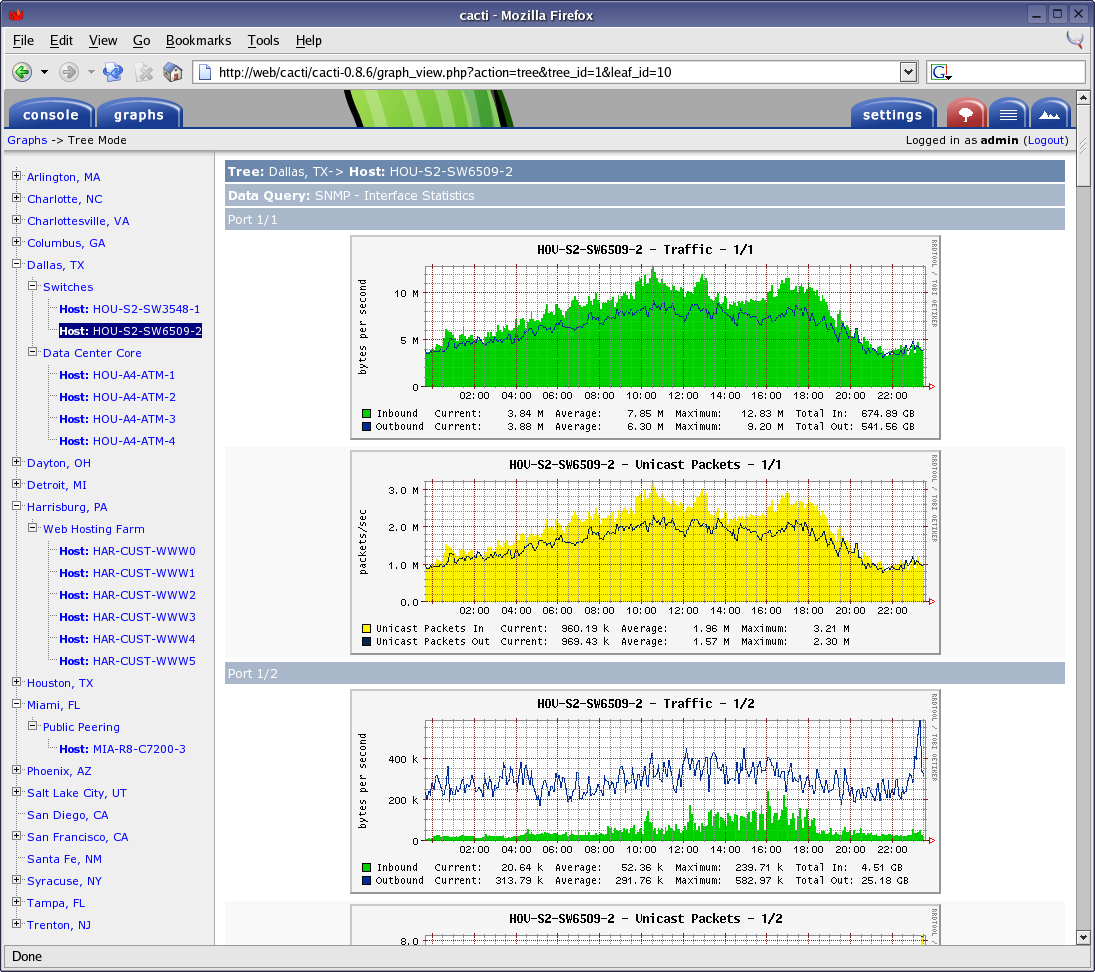
Cacti® is a network monitoring tool that allows you to collect data from almost any network element, including routing and switching systems, firewalls, load balancers, and servers, and put that data into robust graphs. If you have a device, it’s possible that Cacti’s active community of developers has created a monitoring template for it.
Cacti supports SNMP polling, which itself covers a wide range of network devices. You can also extend Cacti’s capabilities to use scripts, queries, or commands for data collection, and save it as a template to use for polling other devices for similar data sets. Cacti leverages the power of RRDTool, which is an open-source data logging and graphing system for storing polled data in the database, and creating graphs from the stored data sets. RRDTool’s data consolidation lets you store collected data forever, and is limited only by the size your storage. Cacti leveraging on RRDTool has the ability to generate any type of graph for any data set, and the graphing used in Cacti is the standard used by many open-source and commercial tools. Cacti also allows you to add multiple users and give them access with or without edit permissions, which is perfect for service providers and enterprises with a large NOC team.
Cacti’s strength lies in its community of developers who have contributed many plug-ins, scripts, and templates that can be used to monitor almost every type of device. We especially like its device support and graphing capabilities.
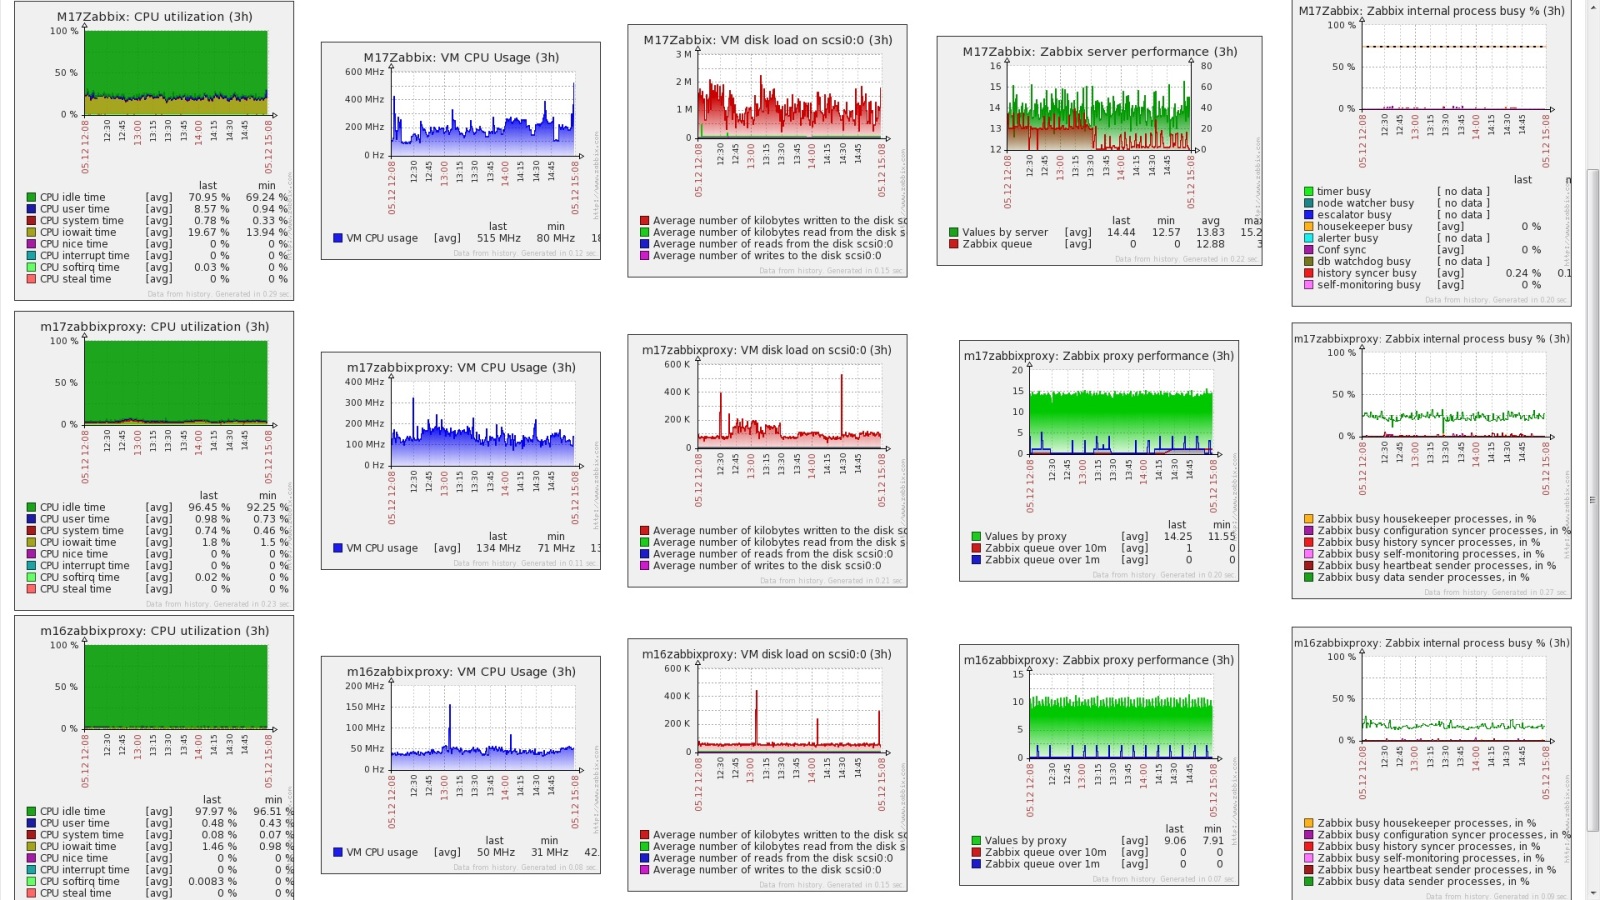
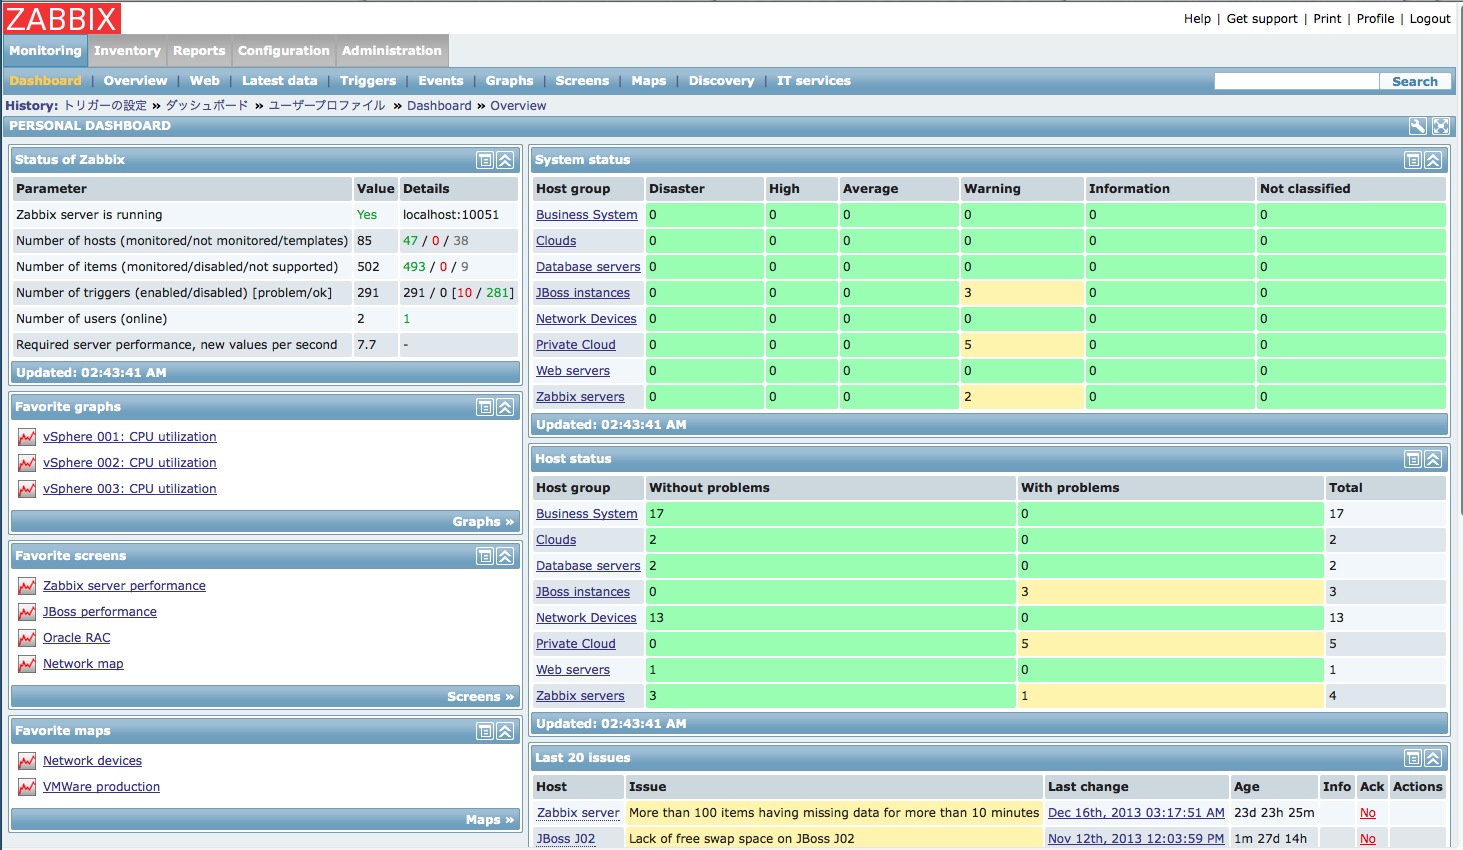
Zabbix is probably the most widely used open-source network monitoring tool after Nagios
Complex to set up, Zabbix® comes with a simple and clean GUI that makes it easy to manage, once you get the hang of it.
Zabbix supports agent-less monitoring using technologies such as SNMP, ICMP, Telnet, SSH, etc., and agent-based monitoring for all Linux® distros, Windows® OS, and Solaris®. It supports a number of databases, including MySQL®, PostgreSQL™, SQLite, Oracle®, and IBM® DB2®. Zabbix’s VMware® monitoring capabilities allow you to customize using any scripting or programming language, which is widely regarded as its best feature.
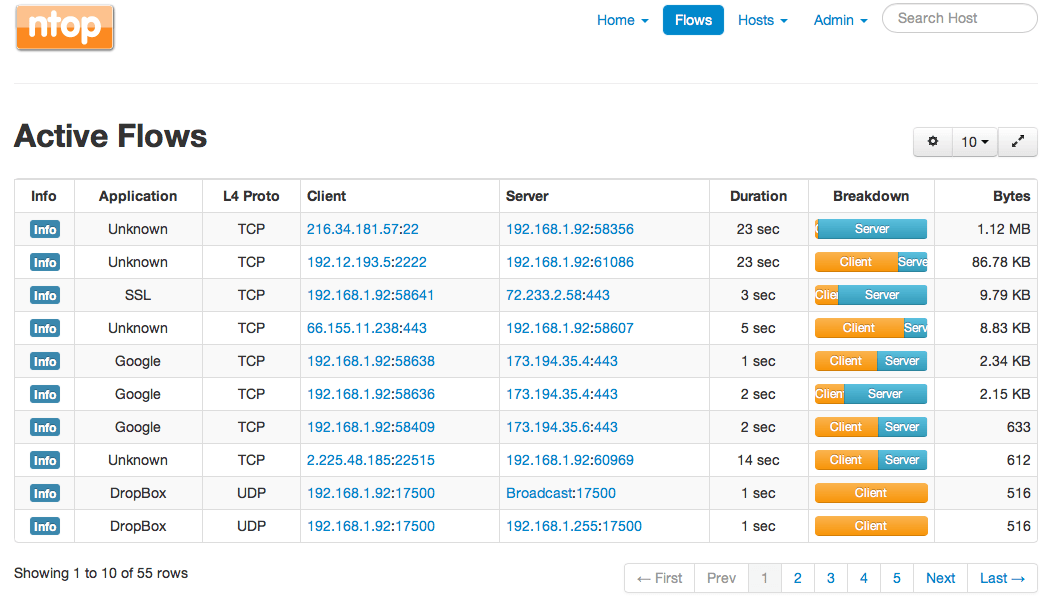
ntop, which is now ntopng (ng for next generation), is a traffic probe that uses libpcap (for packet capture) to report on network traffic.
You can install ntopng on a server with multiple interfaces, and use port mirroring or a network tap to feed ntopng with the data packets from the network for analysis. ntopng can analyze traffic even at 10G speeds; report on IP addresses, volume, and bytes for each transaction; sort traffic based on IP, port, and protocol; generate reports for usage; view top talkers; and even report on AS information. This level of traffic analysis helps you make informed decisions about capacity planning and QoS design, and also helps you find bandwidth-hogging users and applications in the network. ntopng has a commercial version called ntopng pro that comes with some additional features, but the open-source version is good enough to quickly gain insight into traffic behavior. ntop can also integrate with external monitoring applications such as Nagios for alerting, and provide data for monitoring.
Ntopng has some limitations, but the level of network traffic visibility it provides makes it well worth the effort.
Manage Cookie Consent
We use cookies to optimize our website and our service.
Functional
Always active
The technical storage or access is strictly necessary for the legitimate purpose of enabling the use of a specific service explicitly requested by the subscriber or user, or for the sole purpose of carrying out the transmission of a communication over an electronic communications network.
Preferences
The technical storage or access is necessary for the legitimate purpose of storing preferences that are not requested by the subscriber or user.
Statistics
The technical storage or access that is used exclusively for statistical purposes.The technical storage or access that is used exclusively for anonymous statistical purposes. Without a subpoena, voluntary compliance on the part of your Internet Service Provider, or additional records from a third party, information stored or retrieved for this purpose alone cannot usually be used to identify you.
Marketing
The technical storage or access is required to create user profiles to send advertising, or to track the user on a website or across several websites for similar marketing purposes.